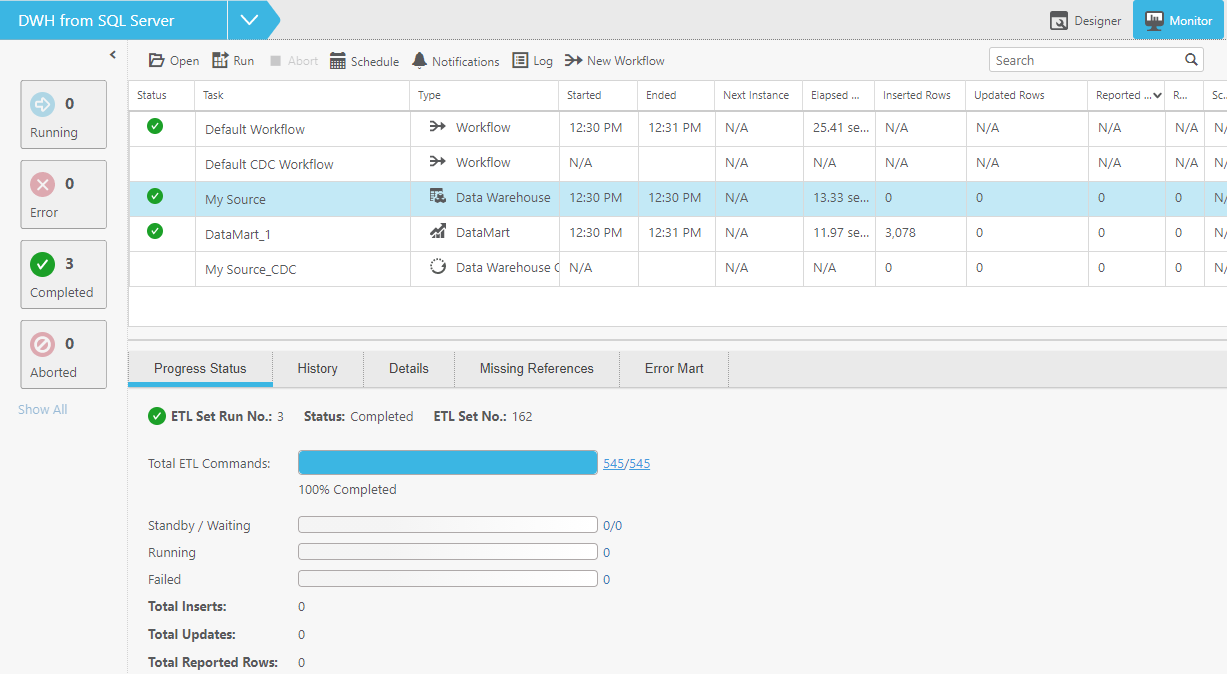
Viewing information in the monitor
As well as providing a high-level summary of all your tasks, the monitor also lets you view more detailed information about specific tasks.
To switch to monitor view:
-
Open a data warehouse project and click the Monitor icon in the top right of the console.
A list of tasks is displayed for the current project. The left pane of the monitor allows you to filter the task list by status as well as indicating the current number of running, failed and completed tasks.

For each task, the monitor displays the following information:
- Status - Running, Completed or Failed
- Name - The task name.
- Type - Data Warehouse, Data Mart, Workflow, Command Task or Replicate Task.
- Started and Ended - The date and time the task started and completed (according to the server time). If the task is running, the Ended column will display the current progress. In the case of a Replicate task performing Change Processing, Running CDC will be displayed.
- Next Instance - The next time the task is due to run (if the task is scheduled).
- Elapsed Time - The time it took for the task to complete or - if the task is still running - how long the task has been running.
- Inserted Rows - The number of rows inserted into the data warehouse or data mart.
- Updated Rows - The number of rows updated in the data warehouse or data mart.
- Reported Rows - The number of rows reported to the error mart table(s). - The number of rows reported to the error mart table(s).
For more information on error marts, see Defining and managing data quality rules.
- Disabled - Whether the scheduled job has been disabled.
-
To view additional information about a task, select the task. The information is displayed in the following tabs in the lower pane of the monitor:
- Details - Use the navigation arrows to browse through task instances. For each entity, the total number of inserted, updated and deleted rows is shown.
-
History - The History tab provides a list of previous task instances.
To view a task instance’s log file, select the task and click the View Log button.
To view more details about a task instance, either double-click the instance or select the instance and then click the View Instance Details button. The Details tab is shown.
-
Progress Status - The Progress Status tab shows the task’s current progress as well as the sub-status of task statements within the task (Waiting/Standby, Running, Failed, etc.). To see details about a specific task statements, click the number to the right of the command status.
For example, to view more information about an task statement with an error status, click the number to the right of Error.
-
Error Mart - The Error Mart tab displays information when one or more Data Quality rules are enforced during the task (and the rules have been configured to report non-compliant data).
The following information is available:
- Entity Name - The name of the entity for which rule was created.
- Mappings - The mapping for which the rule was created.
- Error Mart Table - The name of the error mart table crated as a result of the rule being enforced.
- Schema - The name of the schema containing the error mart table.
- Reported Rows - The number of rows reported to the error mart. Clicking the number opens the actual error mart table as it appears in the data warehouse.
-
Missing References - For a description of this tab, see Viewing missing references.
- To run a job immediately, select the task and then click the Run toolbar button.
- To view a task’s settings, select the task and then click the Open toolbar button. For more information about the settings, see Creating and managing the data warehouse and Creating and managing data marts .
See also: Defining and managing data quality rules.
